Fundamental analysis metrics and value investing
Value investors focus on finding companies that are priced lower than they are worth. There are numerous strategies to evaluate the stocks, but all of them rely on fundamental analysis with key financial metrics.
Value investing is an active investing which requires a lot of attention to track and constantly re-evaluate your stock selection.
Fundamental analysis is a stock analysis based on tangible financial metrics.
Fundamental analysis: is it worth your time?
There is no denial that understanding key financial metrics is useful. Question is how much time you want to spend analyzing and researching your investments.
And the answer depends on your investment strategy. If you are focused on individual stocks, fundamental analysis is much more important than investing into ETFs or mutual funds.
Let’s look at the pros and cons on the ‘very detailed research on stocks’ side of the spectrum:
PROS:
- fundamental analysis allows you to have in-depth understanding of what you are buying
- you have backing data and are not easily swayed by market sentiments
- technically you could find the right winning formula to screen the stocks
CONS:
- it is time consuming to understand the metrics, to screen or search for the right stocks, maintain reevaluating stock
- betting against the market (including insiders, army of analysts and researchers, machine learning algorithms, etc.)
- historically, it’s notoriously hard to outperform benchmark indexes like S&P 500
- susceptible to stock attachment
- higher loss risk (compared to mutual funds or ETFs), needs crafting portfolio to mitigate it
If you wish to become a professional investor, understanding fundamentals and value investing in depth is a must. Adding your own value stocks might be a good addition to your portfolio.
If you wish to use less of your time, ETF investing might be the way to go. ETF performance mirrors your selected market, it has cheap maintenance fees and does not require much of your attention. You can also still apply value investing metrics like PE, PEG, DE, and others when screening for ETFs.
Fundamental analysis: where do I start?
Fundamental analysis and value investing is all about company research. We assume that you already have an investment account and are familiar with trading on stock exchanges, otherwise feel free to have a look at our suggested investment resources.
Let’s go through some of the key concepts of fundamental analysis.
What is fundamental data
“Data is the king” fits right for value investing. Fundamental data is at the heart of establishing the company’s value for a value investor. In order to scout for the (under)valued company you will need detailed information about companies.
Listed companies’ financial data should be publicly available, i.e.: you can find it in financial data sites like Yahoo Finance, Thomson Reuters, WallStreetZen exchanges like NASDAQ or LSE, directly in company public reports, etc.
Say we use TESLA as an example for our fundamental analysis, the financials and metrics in WallStreetZen would look like:

Note that there is a distinction between the value investing and the growth investing, so investors are interpreting fundamental analysis metrics differently. Tesla has been growth investors target and it is used only as an example for our value investigation.
So, we have this massive pool of data about stocks across a number of exchanges, what should we look at as a value investor?
What are the key financial metrics (quantitave indicators)?
Before we go into company valuation strategy details, we need to understand what the fundamental ingredients to creating a recipe are.
Profit growth (EPS)
Earnings-per-share, or EPS ratio is a fundamental analysis metric that shows how much profit a company makes for each share. It’s calculated by taking a company’s net profit and dividing it by the number of shares.
EPS shows the company’s profitability per share, however, note that the share number might change over time (dilute). Same goes for profits as the company might have one-off gains or losses that would distort EPS for that period. To mitigate (un)intended EPS ratio manipulations there are a few EPS calculation flavors. “Basic EPS” is commonly used by analysts which uses weighted number of shares to avoid share dilution impact. For our fundamental analysis it might be also worth checking historical earnings, i.e.:

Market valuation based on earnings (PE ratio)
Price-to-earnings, or PE ratio is a fundamental analysis metric that shows how the market values the company in respect of its earnings.
PE metrics is usually available, and it is calculated by one of the following methods:
- take share price and divide it by earnings per share
- take market capitalization and divide it by net income
Results from any of the above methods should be the same
In fundamental analysis, PE shows how much investors are willing to pay for a $1 of earnings.
It might become a little tricky once we drill into details about what earnings we consider important. We might have future earnings projections, historical earnings, skewed earnings which are spiked due to one-time sell offs, acquisitions, etc. If we follow our Tesla example, we can see that in effect below:
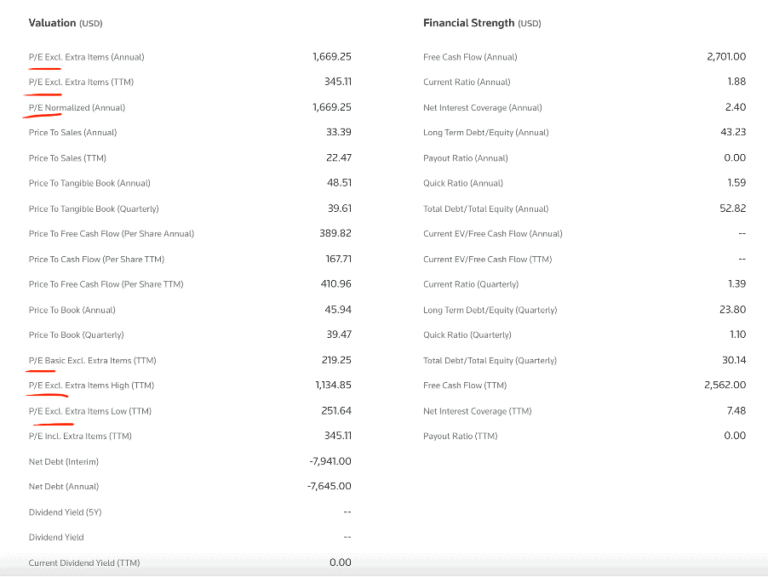
A commonly used PE is TTM PE which means “twelve months trailing” PE based on the last 4 quarters of the company statements.
Normalized annual PE is based on normalized annual earnings. Normalized earnings are adjusted to remove non-recurring charges or gains.
You can also come across metrics called ‘forward PE’ which is based on estimated earnings rather than historic data.
You might find slightly different data for the same company for the same type of PE across different data providers. That depends on earnings normalization method.
Let’s have a look at historical PEs:

To recap, in fundamental analysis PE shows how many times more investors are willing to pay over a company’s earnings. Different sectors have different benchmark PEs, also PE has embedded growth expectation aspect. It is worth comparing company’s PE with the sector’s PE or close competitors’ PE. In the Tesla example we can see that investors are willing to pay $337 for every dollar earned over the last year. That gives you an indication that Tesla’s earnings growth anticipation in the market is huge.
Market valuation based on book value (PB and PTBV ratios)
Price-to-book, or PB ratio is a fundamental analysis metric that shows company’s market capitalization to it’s net value ratio. It is calculated by dividing company’s market value by its book value.
Market value depends on current stock price which is computed by multiplying it with the number of company shares.
Book value is determined by adding all company assets and subtracting all its liabilities.
PB ratio indicates how does the market value the company in respect of its current ‘paper’ value.
There is also a variation of PB called price-to-tangible-book ratio, or PTBV. It essentially uses the same formula but just removes the ‘intangibles’ from company assets (patents, intellectual property, etc.)
Let’s look at our Tesla example:


This shows that the market valuation of Tesla is 38 times higher than the book value of Tesla. This is an indication that investors see growth in future net value of the company. That would adjust its balance in the future to correlate with the market price more closely.
Debt (DE ratio)
Debt-to-equity, or DE ratio is a fundamental analysis metric that indicates how much debt does the company have compared to its net value. It is calculated by dividing company’s debt by equity. Net value, or equity, is equal to all company assets minus all liabilities.
Lower DE ratio shows lower debt proportion, so the lower number is preferable. On the opposite side, the higher the number, the ‘redder the flag’.
In fundamental analysis, acceptable DE for value investor varies by industry, and it’s useful to compare it against a sector benchmark, let’s use our Tesla example again:

In fundamental analysis, DE value below 1 would imply that by liquidating the company, selling all assets, and covering all liabilities, shareholders would still have extra funds to distribute.
Free Cash Flow (FCF)
Free cash flow, or FCF is a fundamental analysis metric that is computed by summing up all generated cash minus the cash needed to cover all expenditures. There are a number of variations but generally interest rate payments are excluded from expenditures calculation.
This indicates the company’s leftover cash after using all the operating expenses in the chosen period.
In fundamental analysis, a strong cash flow indicates that there is a potential for the earnings to go up, which would also affect the share’s price positively.

In cash flow analysis we look at the trend rather than absolute values. It might also be worth drilling down to the composition of the cash flow as well as looking at historical data.
Market valuation based on earnings growth (PEG ratio)
Price-to-earning-growth, or PEG ratio is a fundamental analysis metric that shows the growth rate for the company. It’s the stock’s PE ratio divided by the growth rate of its earnings. Growth rate is open for interpretation and can be derived from historical data forecast, hence when comparing companies, it’s important to use the same method.
I.e.: if earnings over the last 5 years have been growing by 20% annually, and PE ratio is 50, then PEG=50/20=2.5
In fundamental analysis, the PEG is complementary to PE and indicates expected growth for the company. The lower the PEG ratio, the quicker the company growth.

For a value investor, generally a PEG of 1 or lower would be considered good.
Profitability based on equity (ROE ratio)
Return on equity, or ROE is a fundamental analysis metric that indicates how efficient a company uses its equity to generate its profit. It is calculated by taking the net income (total gross income minus expenses) and dividing it by equity (assets minus liabilities).
In fundamental analysis, ROE is useful when you are comparing companies against the benchmark in the same industry.

Dividends
Dividends is company profits that are distributed to its shareholders.
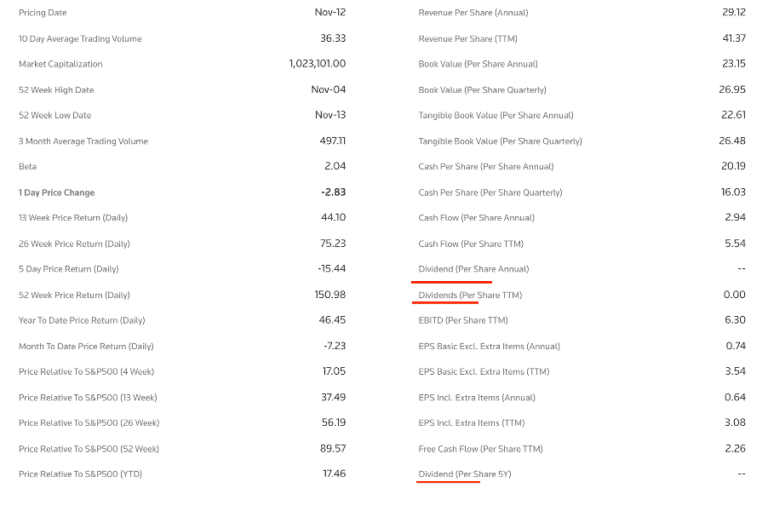
In our example we see that Tesla do not pay dividends to their shareholders, so investor profits are coming from stock value changes.
Putting it all together: company valuation
Screener
Okay, so we now know a little bit more about fundamental analysis and different kinds of metrics, but how do we use it in practice?
A good starting point would be selecting the sector you’d like to invest and shortlist the companies you are interested in, and then start comparing these stocks using the metrics discussed above.
Finding out what the most important metrics are is relative to every individual and everyone could select their own combination in order to lead themselves into answering the key question that is “what will be the stock price in the future”?
There are a number of stock screening tools that you can use for filtering stocks based on your parameters. Good free tool is a Yahoo stock screener.

Tracker
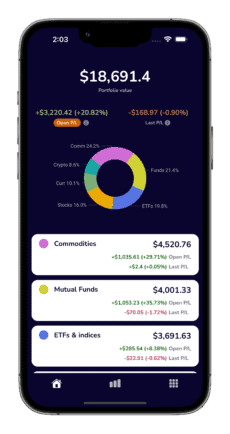
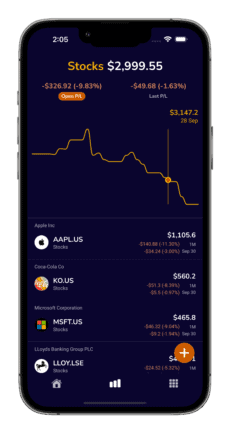
Whether you choose to apply fundamental analysis and value investing in stocks or ETFs, you will need to track your portfolio. TotFin offers consolidated stocks, ETFs, and mutual funds monitoring with the TotFin portfolio tracker. It allows consolidated tracking that is designed to have both a concise segments overview, more detailed assets overview and optional drill-down to lower level fundamental metrics details for optimum information analysis.
What are key qualitative fundamental indicators
Apart from tangible metrics there are a number of other aspects that might also impact a stock price.
These should also be taken into consideration, i.e.:
- geopolitical situation (i.e.: custom duty changes, supply chain issues, etc.)
- political situation (i.e.: legislation changes, fines, public sentiment, etc.)
- macroeconomics (currency value changes, inflation, stock market trends, etc.)
- sector (sector position in the market, sector trends, etc.)
- company (service quality, values, brand, marketing, management team, etc.)
- competition (market position, niche, competitor services, growth, etc.)